Verizon Communications (NYSE: VZ) reports third-quarter 2026 results on Monday, October 26, 2026, with the earnings webcast at 8:30 a.m. Eastern. The company raised its full-year adjusted EPS guidance twice this year. This preview lines up the recent quarters against the same quarters a year earlier, works out what the guidance implies for the second half, and covers analyst consensus, the dividend and what to watch.
The recent quarters, each against the same quarter a year earlier
| Metric | Q3 2025 (vs Q3 2024) | Q1 2026 (vs Q1 2025) | Q2 2026 (vs Q2 2025) |
|---|---|---|---|
| Total operating revenue | $33,821 million (+1.5% from $33,330 million) | $34.44 billion (+2.9% from $33.49 billion) | $34,253 million (-0.7% from $34,504 million) |
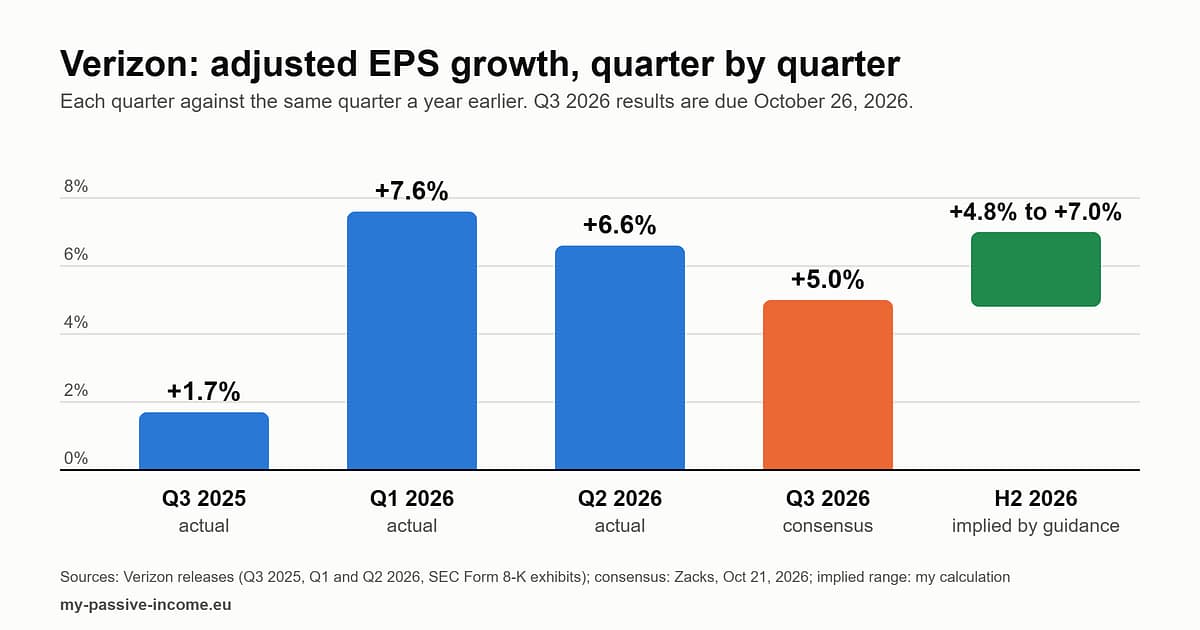
| Adjusted EPS | $1.21 (from $1.19: +1.7%) | $1.28 (from $1.19: +7.6%) | $1.30 (from $1.22: +6.6%) |
| Adjusted EBITDA | $12,775 million (from $12,491 million: +2.3%) | $13,395 million (from $12,555 million: +6.7%) | $13,723 million (from $12,807 million: +7.2%) |
| Postpaid phone net additions | +44,000 (consumer -7,000, business +51,000); year-earlier total not in the release excerpt I reviewed | +55,000 (from -289,000) | +184,000 (from -9,000) |
Sources: the three Verizon earnings releases listed under Sources (Q3 2025 on October 29, 2025; Q1 2026 on April 27, 2026; Q2 2026 on July 24, 2026). The percentage changes for adjusted EPS and, for Q3 2025, adjusted EBITDA are my calculations from the figures in the releases. Adjusted EPS excludes special items. In Q2 2026, reported (GAAP) EPS was $0.92 against $1.18 a year earlier (-22.0%), because pre-tax special items of about $1.8 billion were charged in the quarter, including a $746 million loss on the disposition of the international wireline connectivity and managed network services business (held for sale), $397 million of severance and $258 million of asset rationalization charges. The Q2 revenue decline came from wireless equipment revenues, down 19.7% to $5.0 billion, while service revenues and other rose 3.5% to $29.2 billion.
Full-year guidance: three updates, same metrics
| Metric (full year 2026) | January 30, 2026 | April 27, 2026 | July 24, 2026 |
|---|---|---|---|
| Adjusted EPS | $4.90 to $4.95 (about +4.0% to +5.1% on $4.71, my calculation) | $4.95 to $4.99 (+5.0% to +6.0%) | $4.99 to $5.04 (+6.0% to +7.0%) |
| Free cash flow | $21.5 billion or more | $21.5 billion or more (about +7%) | $21.94 to $22.14 billion (+9.0% to +10.0%) |
| Capital expenditures | $16.0 to $16.5 billion | $16.0 to $16.5 billion | $16.0 to $16.5 billion |
| Mobility and broadband service revenue growth | +2.0% to +3.0% | +2.0% to +3.0% | +2.5% to +3.0% |
| Wireless service revenue growth | approximately flat | approximately flat | approximately flat |
| Postpaid phone net additions | 750,000 to 1.0 million | upper half of 750,000 to 1.0 million | upper half of 750,000 to 1.0 million |
Sources: the Verizon releases of January 30, April 27 and July 24, 2026. Full-year 2025 adjusted EPS was $4.71 (from $4.59 in 2024), and free cash flow was $20.1 billion. In the July release the company also said it expects mobility and broadband service revenue growth to approach 3.0% in Q3 and about 4.0% in Q4, and raised its share buyback target to up to $4.5 billion, with $3.5 billion repurchased year to date.
What the guidance implies for the second half (my calculation)
| Item | Amount |
|---|---|
| Adjusted EPS, full year 2025 (company) | $4.71 |
| Adjusted EPS, first half 2025 (Q1 $1.19 + Q2 $1.22) | $2.41 |
| Adjusted EPS, second half 2025 (Q3 $1.21 + Q4 $1.09) | $2.30 |
| Adjusted EPS, first half 2026 (Q1 $1.28 + Q2 $1.30) | $2.58 (+7.1% vs first half 2025) |
| Full-year 2026 guidance (July 24) | $4.99 to $5.04 |
| Implied second half 2026 | $2.41 to $2.46 |
| Implied growth, second half 2026 vs second half 2025 | +4.8% to +7.0% |
In other words, the guidance leaves the second half growing at roughly the pace of the first half or somewhat slower at the low end. These are my own calculations from company figures; the company does not publish a second-half forecast.
What analysts expect, and the share price
This section uses third-party data, which is not from the company; each figure carries its source and date. Consensus is for the same quarter, compared with the same quarter a year earlier.
| Q3 metric | Consensus for Q3 2026 | Q3 2025 actual (company) | Change |
|---|---|---|---|
| Adjusted EPS | $1.27 (Zacks, article dated October 21, 2026; MarketBeat, October 19, 2026) | $1.21 | +5.0% |
| Total operating revenue | $34.81 billion (Zacks, October 21); $34.77 billion (MarketBeat, October 19) | $33,821 million | +2.8% to +2.9% |
If Q3 comes in at the $1.27 consensus, the implied second half of $2.41 to $2.46 leaves $1.14 to $1.19 for the fourth quarter, against $1.09 in Q4 2025: between roughly +4.6% and +9.2%, quarter against quarter (my calculation). A beat in Q3, or another guidance raise, would shift that picture.
On Thursday, October 22, 2026, VZ was trading at about $45.16 mid-day, up 3.7% from the previous close of $43.56 (source: MarketBeat, October 22, 2026; intraday, not a closing price). The stock was below its 50-day and 200-day averages ($47.65 and $46.66). Against the July 24 full-year guidance, this gives (my calculation):
| Measure | Value |
|---|---|
| Share price (intraday, Oct 22, 2026) | $45.16 |
| Price to 2026 adjusted EPS guidance of $4.99 to $5.04 | about 9.0x |
| Quarterly dividend of $0.7075, $2.83 a year | yield about 6.3% on the price above |
| Annual dividend as a share of guided adjusted EPS | about 56% to 57% |
Price and consensus move daily, so check both with your broker before the release. MarketBeat shows a payout ratio of 73.7%, which is calculated on a different earnings basis than the adjusted guidance used here.
What to watch on October 26
- Adjusted EPS against $1.21 in Q3 2025 and against the $1.27 consensus. Verizon’s adjusted EPS grew 7.6% in Q1 and 6.6% in Q2; consensus asks for +5.0% in Q3.
- Postpaid phone net additions. The company expects the full year in the upper half of 750,000 to 1.0 million, which I read as 875,000 to 1.0 million. Net additions were 55,000 in Q1 and 184,000 in Q2, 239,000 in total, so the second half would need about 636,000 to 761,000 (my calculation). Q3 2025 was +44,000.
- Mobility and broadband service revenue growth, which the company said would approach 3.0% in Q3 and about 4.0% in Q4, within a full-year guide of 2.5% to 3.0%.
- Wireless equipment revenues, which fell 19.7% in Q2 and dragged total revenue down 0.7%. Zacks shows a consensus for these revenues of $5.45 billion in Q3, down 3% from a year earlier.
- Free cash flow. Q1 and Q2 free cash flow totalled $10,209 million against $8,804 million in the first half of 2025, up 16.0% (my calculation). The full-year guide of $21.94 to $22.14 billion rises 9% to 10%.
- Balance sheet and buybacks. The ratio of net unsecured debt to adjusted EBITDA was 2.5x at June 30, 2026, up from 2.2x at the end of 2025, while the company raised its buyback target to up to $4.5 billion.
The dividend
On September 9, 2026, Verizon declared a quarterly dividend of $0.7075 per share ($2.83 a year), the same rate as the previous quarter. The record date was October 9, 2026 and it is payable on November 2, 2026, so buying shares now does not earn this payment.
For investors in Europe
- VZ pays in U.S. dollars, and U.S. withholding tax applies by default; the rate for non-U.S. investors depends on your broker having a valid Form W-8BEN. See our W-8BEN guide.
- The dollar and euro exchange rate moves the euro value of the dividend independently of anything Verizon reports.
Sources
- Verizon: Q3 2026 earnings report date notice (September 28, 2026)
- Verizon: Q3 2025 results, Form 8-K exhibit (October 29, 2025)
- Verizon: Q4 and full-year 2025 results and 2026 guidance (press release, January 30, 2026)
- Verizon: Q1 2026 results, Form 8-K exhibit (April 27, 2026)
- Verizon: Q2 2026 results, Form 8-K exhibit (July 24, 2026)
- Verizon: quarterly dividend declaration (September 9, 2026)
- Third-party data (consensus and price), not from the company: Zacks Equity Research (article dated October 21, 2026); MarketBeat (October 19, 2026); MarketBeat (October 22, 2026)
Disclaimer: This article is for informational purposes only and does not constitute investment advice. Company figures are taken from the releases listed; consensus and the share price come from the third-party sources listed, as of the dates stated; and the second-half, fourth-quarter and valuation figures are my own arithmetic, not a company forecast. Confirm current figures with your broker or the company’s investor relations page. Investing involves risk, including the possible loss of capital, and a dividend payment is never guaranteed.