The Chowder Rule is a quick screen that dividend-growth investors use to judge whether a stock’s yield and its dividend growth look attractive together. It is a rule of thumb from the investing community, not an official standard, and it says nothing on its own about whether a dividend is safe. This guide explains the formula and the commonly quoted thresholds, walks through three worked examples with real figures, covers where the rule misleads, and lists what a European investor should check on top. Dividend figures come from company releases and share prices from a dated third-party source; all calculations are our own arithmetic.
What the Chowder Rule is
The Chowder Number is the current dividend yield plus the five-year dividend growth rate. Yield is the income you receive today; growth is how fast that income has been rising; the sum is a crude proxy for the long-run return you might get from dividends alone. A September 2024 newsletter (Onveston) traces the idea to a 2013 blog post and says the name was coined later by a Seeking Alpha contributor. It describes the original logic this way: 8% was the long-term portfolio growth goal, and 12% was set as the target to leave a margin of safety.
The thresholds usually quoted
| Case | Minimum Chowder Number | Where it is quoted |
|---|---|---|
| Yield above 3%, general dividend stocks | 12 | Sure Dividend (updated 2 March 2023); Onveston (16 September 2024) |
| Yield below 3% | 15 | Sure Dividend; Onveston |
| Utilities (Onveston adds telecoms and MLPs) | 8 | Sure Dividend; Onveston |
| Two targets only: 12 in general, 8 for utilities and slower-growth sectors | 12 / 8 | Liberated Stock Trader (page is undated) |
The sources do not agree exactly, so decide which version you use and apply it consistently. Onveston also lists quality screens attributed to the rule’s author: a credit rating of BBB+ or better, a yield at least 50% above the S&P 500 yield, and dividend growth of at least 5% a year. None of these thresholds is official.
How to calculate it, step by step
- Yield. Annual dividend per share divided by the share price. For a quarterly payer, multiply the latest quarterly dividend by four.
- Growth. Take the dividend per share now and five years ago, then compute (now ÷ then)1/5 − 1. Use the same kind of figure at both ends, for example the rate in force after each annual raise.
- Add them. Yield % plus growth % gives the Chowder Number.
- Compare. Check the result against the threshold for the stock’s yield band or sector.
Some write-ups average the five yearly increases instead of using the compound rate. Either is acceptable if you stay consistent.
Three worked examples
We picked one US consumer-staples company, one German insurer and one US utility. Prices are 11 November 2026 closes from StockAnalysis.com (NYSE for PG and DUK, Xetra for ALV). This is a demonstration of the arithmetic, not a view on any of these shares.
| Company | Dividend now | Dividend five years earlier | Price (11 Nov 2026) | Yield | 5-year growth | Chowder Number | Threshold |
|---|---|---|---|---|---|---|---|
| Procter & Gamble (PG) | $1.0885 quarterly (declared 14 April 2026) | $0.8698 quarterly (declared 13 April 2021) | $167.67 | 2.60% | 4.59% a year | 7.2 | 15 (yield under 3%) |
| Allianz (ALV) | €17.10 for FY2025 (AGM 2026 proposal) | €9.60 for FY2020 (announced 19 February 2021) | €463.60 | 3.69% | 12.24% a year | 15.9 | 12 |
| Duke Energy (DUK) | $1.085 quarterly (declared 14 July 2026) | $0.985 quarterly (rate before the July 2022 raise; see note) | $128.77 | 3.37% | 1.95% a year | 5.3 | 8 (utility) |
Procter & Gamble. P&G raised its dividend by 3% in April 2026, its 70th consecutive annual increase, after a 10% raise in April 2021. Annualised, $1.0885 × 4 = $4.354, which is 2.60% of $167.67. The five-year growth is (1.0885 ÷ 0.8698)1/5 − 1 = 4.59%. The total of 7.2 is far below the 15 that applies to yields under 3%. A famously reliable payer fails the screen because the rule rewards the speed of growth, not the length of the record.
Allianz. Allianz proposed €17.10 for 2025, up 11% from €15.40, after holding €9.60 flat for 2020. €17.10 ÷ €463.60 is 3.69%, and (17.10 ÷ 9.60)1/5 − 1 is 12.24%, so the number is 15.9 against a threshold of 12. Note the base-year effect: the starting point was a flat pandemic-era payout, which flatters the growth rate. Allianz’s own dividend page puts the average increase over the past ten years at 9%, which would give a lower, though still passing, score of about 12.7 (3.69 + 9). The dividend is paid in euros, with an ex-dividend date of 8 May 2026.
Duke Energy. Duke raised its quarterly dividend by $0.02 to $1.085 in July 2026. Its July 2022 release gave $1.005 after a $0.02 increase, so the rate before that raise was $0.985 (our deduction from the release). $1.085 × 4 = $4.34, or 3.37% of $128.77, and growth is 1.95% a year. The total of 5.3 misses even the lower utility bar of 8, a reminder that regulated utilities often grow dividends slowly. That does not make the company a poor one; it means the screen is not built to reward that profile. Related reading: our Duke Energy earnings preview and our Allianz earnings preview.
Limits and false positives
A high yield can inflate the score. As a hypothetical, a stock yielding 9% with 4% growth scores 13 and clears the 12 bar, yet a yield that high can mean the market doubts the dividend will last. The rule cannot tell a bargain from a trap.
It looks backwards. Five-year growth is history. A company that has just cut its dividend can still show healthy growth for years, and one big raise can flatter the figure long after.
Base-year and cyclical effects. As the Allianz case shows, the start date matters. Commodity producers and banks, whose payouts swing with the cycle, can look strong or weak depending on where the five-year window begins.
The 3% cliff. A stock yielding 2.9% needs 15, while one yielding 3.1% needs 12. The threshold jumps, so near the line treat the result as a prompt for more research, not a verdict.
One-off raises and special dividends can distort growth, and sector differences, such as utilities and telecoms, are handled only by a single lower bar.
Chowder Number versus a payout-ratio check
The payout ratio, dividends divided by earnings or free cash flow, asks how much room a company has to keep paying. The Chowder Number asks how attractive yield and past growth look. They answer different questions, so use both. A Chowder Number above 12 with a payout ratio above 100% of earnings means the dividend is being funded from borrowing or reserves. Neither measure guarantees a payout, and neither covers debt levels or earnings stability, which need separate checks.
What a European investor should also check
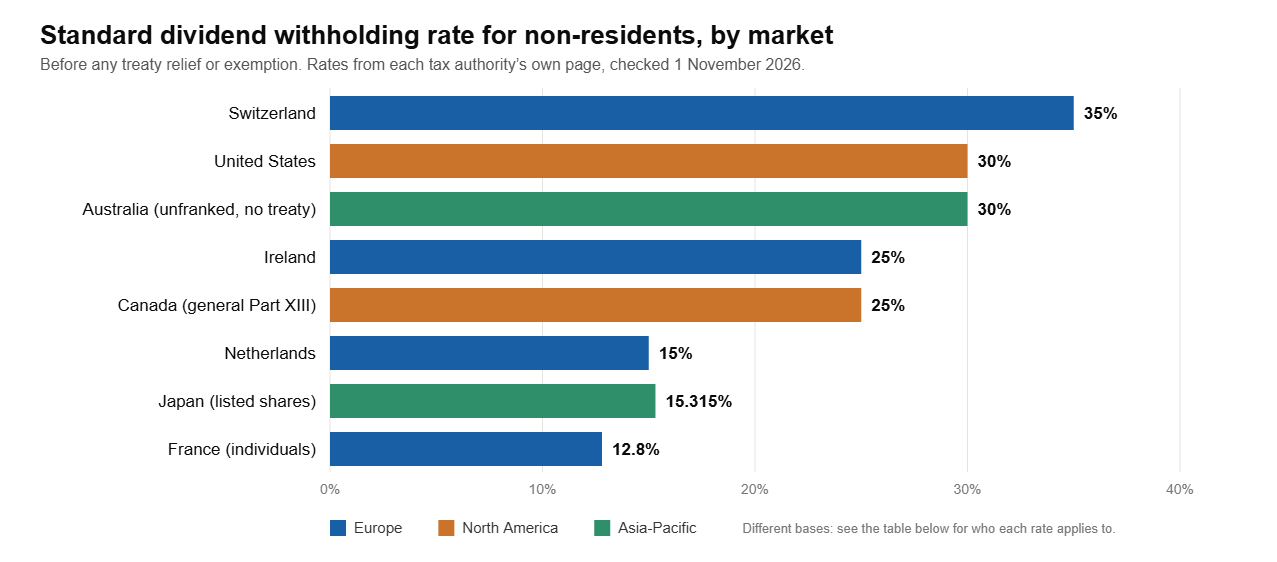
The Chowder Number uses the gross yield. Before relying on it, look at how much tax is taken at source and what you owe at home: our guide Dividend Withholding Tax by Country compares eight major markets. Also consider currency, since US dividends are paid in dollars and the euro value of your income moves with the exchange rate, and the timing of payments, which you can follow in our weekly ex-dividend roundup. For more on judging payout quality, see Dividend Watch #2.
Sources
- Sure Dividend, Chowder Rule page, updated 2 March 2023: suredividend.com
- Onveston, “The Inventor of The Chowder Rule And This Original Thoughts”, published 16 September 2024: onveston.substack.com
- Liberated Stock Trader, Chowder Rule page (undated): liberatedstocktrader.com
- Procter & Gamble, dividend releases (Form 8-K) of 14 April 2026 and 13 April 2021: 2026 release, 2021 release
- Allianz: results announcement of 19 February 2021 (€9.60 for 2020); AGM 2026 agenda (€17.10 for 2025); dividend page (€15.40 prior year, ex-dividend date 8 May 2026, 9% ten-year average)
- Duke Energy dividend releases of 14 July 2026 (via Finviz/PR Newswire) and 13 July 2022 (via Stock Titan)
- Share prices, closes of 11 November 2026: PG, DUK, ALV (StockAnalysis.com; P&G’s 10 November close of $168.66 also appears on heygotrade.com)
Get new articles by email
Ex-dividend dates, earnings previews and P2P platform changes, straight to your inbox. Unsubscribe anytime.
Disclaimer: This article is for informational purposes only and does not constitute investment advice. The Chowder Rule is a community rule of thumb, not an official standard. Dividend figures are taken from the company releases listed; share prices come from the third-party source listed, as of the dates stated; yields, growth rates and Chowder Numbers are our own arithmetic. Confirm current figures with your broker or the company’s investor relations page. Investing involves risk, including the possible loss of capital, and a dividend payment is never guaranteed.