Amgen (NASDAQ: AMGN) reports third-quarter 2026 results on Tuesday, November 3, 2026, after the U.S. market close, with the conference call and webcast at 4:30 p.m. Eastern (10:30 p.m. Central European Time, my conversion). The full-year guidance ranges in the August 4 release are higher than those of April 30. This preview lines up the recent quarters against the same quarters a year earlier, works out what the guidance implies for the second half, and covers analyst consensus, the dividend and what to watch.
The recent quarters, each against the same quarter a year earlier
| Metric | Q3 2025 (vs Q3 2024) | Q4 2025 (vs Q4 2024) | Q1 2026 (vs Q1 2025) | Q2 2026 (vs Q2 2025) |
|---|---|---|---|---|
| Total revenues | $9,557 million (+12.4% from $8,503 million) | $9,866 million (+8.6% from $9,086 million) | $8,618 million (+5.8% from $8,149 million) | $10,054 million (+9.5% from $9,179 million) |
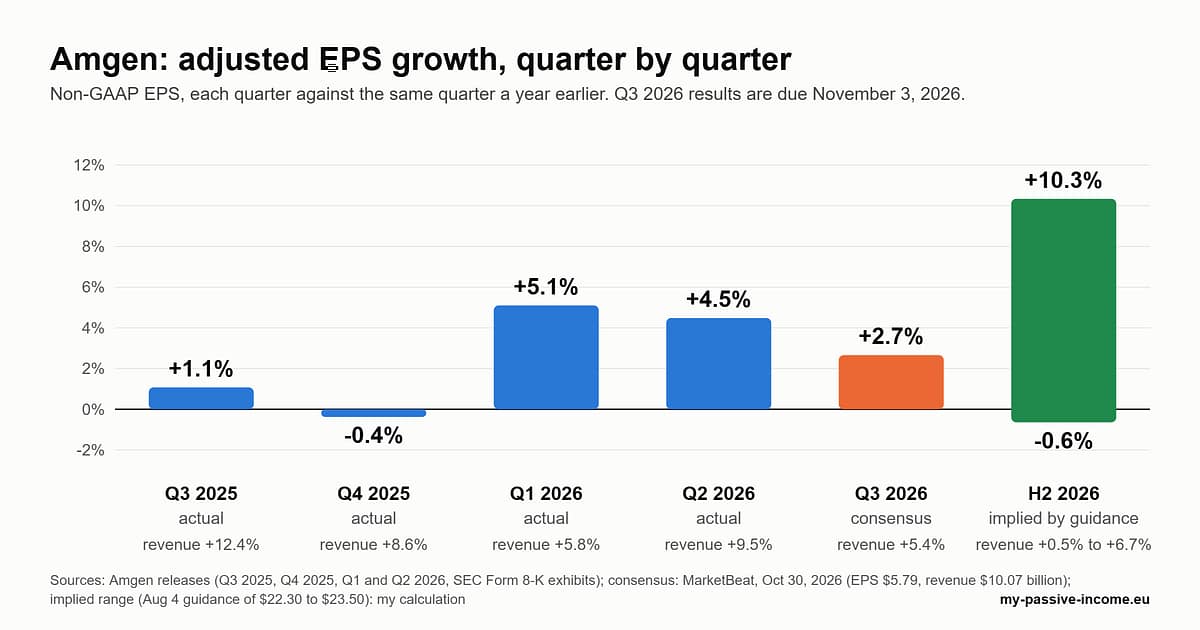
| Non-GAAP EPS | $5.64 (from $5.58: +1.1%) | $5.29 (from $5.31: -0.4%) | $5.15 (from $4.90: +5.1%) | $6.29 (from $6.02: +4.5%) |
| Repatha sales | $794 million (from $567 million: +40.0%) | $870 million (from $606 million: +43.6%) | $876 million (from $656 million: +33.5%) | $953 million (from $696 million: +36.9%) |
| Prolia sales | $1,139 million (from $1,045 million: +9.0%) | $1,054 million (from $1,165 million: -9.5%) | $727 million (from $1,099 million: -33.8%) | $759 million (from $1,122 million: -32.4%) |
| Free cash flow | $4,248 million (from $3,314 million: +28.2%) | about $1.0 billion (from about $4.4 billion; rounded in the release) | $1,477 million (from $980 million: +50.7%) | $3,489 million (from $1,911 million: +82.6%) |
Sources: the four Amgen earnings releases listed under Sources (Q3 2025 on November 4, 2025; Q4 and full-year 2025 on February 3, 2026; Q1 2026 on April 30, 2026; Q2 2026 on August 4, 2026). Percentage changes are my calculations from the figures in the releases, except where the release gives a rounded change. Non-GAAP EPS excludes items the company adjusts for; reported (GAAP) diluted EPS was $5.93 in Q3 2025 (from $5.22), $2.45 in Q4 2025 (from $1.16), $3.34 in Q1 2026 (from $3.20) and $4.37 in Q2 2026 (from $2.65). The quarterly non-GAAP figures for 2025 add up to $21.85 against the company’s full-year figure of $21.84, a one-cent difference from share-count rounding. In the Q2 2026 release, Amgen said the free cash flow increase reflected mainly the final repatriation tax payment made in Q2 2025, together with current business performance. Prolia faces biosimilar competition; the Q2 release attributes the 32% decline to it.
Full-year guidance: three updates, same metrics
| Metric (full year 2026) | February 3, 2026 | April 30, 2026 | August 4, 2026 |
|---|---|---|---|
| Total revenues | $37.0 to $38.4 billion (+0.7% to +4.5% on $36,751 million) | $37.1 to $38.5 billion (+0.9% to +4.8%) | $38.2 to $39.4 billion (+3.9% to +7.2%) |
| Non-GAAP EPS | $21.60 to $23.00 (-1.1% to +5.3% on $21.84) | $21.70 to $23.10 (-0.6% to +5.8%) | $22.30 to $23.50 (+2.1% to +7.6%) |
Sources: Amgen releases of February 3, April 30 and August 4, 2026. Full-year 2025 total revenues were $36,751 million (from $33,424 million in 2024, +10%) and non-GAAP EPS was $21.84 (from $19.84, +10%). The growth percentages against 2025 are my calculations. The releases present the ranges without labelling them as raised; the statement that the August ranges are above the April ranges is my comparison of the published figures. Other August guidance items: capital expenditures of about $2.6 billion and share repurchases not to exceed $3.0 billion; the company repurchased no shares in Q2 2026.
What the guidance implies for the second half (my calculation)
| Item | Total revenues | Non-GAAP EPS |
|---|---|---|
| First half 2025 (Q1 + Q2) | $17,328 million | $10.92 ($4.90 + $6.02) |
| Second half 2025 (Q3 + Q4) | $19,423 million | $10.93 ($5.64 + $5.29) |
| First half 2026 (Q1 + Q2) | $18,672 million (+7.8% vs first half 2025) | $11.44 ($5.15 + $6.29; +4.8% vs first half 2025) |
| Full-year 2026 guidance (August 4) | $38.2 to $39.4 billion | $22.30 to $23.50 |
| Implied second half 2026 | $19,528 to $20,728 million | $10.86 to $12.06 |
| Implied growth vs second half 2025 | +0.5% to +6.7% | -0.6% to +10.3% |
The implied ranges are wide because the full-year guidance is itself a range of about $1.2 billion in revenue and $1.20 in EPS. The low end of the EPS guidance would leave the second half roughly flat on a year earlier; the high end would need clearly faster growth than the first half. These are my own calculations from company figures; the company does not publish a second-half forecast. Adding the first-half 2025 EPS to the full-year figure instead of summing quarters changes the second-half base by one cent.
What analysts expect, and the share price
This section uses third-party data, which is not from the company; each figure carries its source and date. Consensus is for the same quarter, compared with the same quarter a year earlier.
| Q3 metric | Consensus for Q3 2026 | Q3 2025 actual (company) | Change |
|---|---|---|---|
| Non-GAAP EPS | $5.79 (MarketBeat, page showing the October 30, 2026 close; also its article of October 27, 2026); $5.74 (Zacks preview, undated, published before October 29, 2026) | $5.64 | +2.7% (MarketBeat); +1.8% (Zacks) |
| Total revenues | $10.07 billion (MarketBeat, October 30; $10.08 billion in its October 27 article); $9.95 billion (Zacks) | $9,557 million | +5.4% (MarketBeat, October 30); +4.1% (Zacks) |
| Repatha sales | $1.04 billion (Zacks) | $794 million | +31.0% |
| Evenity sales | $727 million (Zacks) | $541 million | +34.4% |
| Tezspire sales | $553 million (Zacks) | $377 million | +46.7% |
| Prolia sales | $686 million (Zacks) | $1,139 million | -39.8% |
If Q3 comes in at the $5.79 consensus, the implied second half of $10.86 to $12.06 leaves $5.07 to $6.27 for the fourth quarter, against $5.29 in Q4 2025: between -4.2% and +18.5%, quarter against quarter (my calculation). A beat or miss in Q3, or a change in guidance, would shift that picture. One data point to treat with care: MarketBeat’s October 27 article cites $6.02 as the year-ago EPS, but that is the Q2 2025 figure; Amgen’s Q3 2025 release shows $5.64, and MarketBeat’s October 30 page shows $5.64 too.
AMGN closed at $466.01 on Friday, October 30, 2026 (source: MarketBeat, October 30, 2026). On October 27, MarketBeat listed a one-year range of $288.00 to $450.98, a 50-day average of $417.26 and a 200-day average of $371.70, and an analyst consensus rating of Hold (1 Strong Buy, 10 Buy, 16 Hold, 3 Sell) with a consensus price target of $389.71. Against the August 4 full-year guidance, this gives (my calculation):
| Measure | Value |
|---|---|
| Share price (close, Oct 30, 2026) | $466.01 |
| Price to 2026 non-GAAP EPS guidance of $22.30 to $23.50 | about 19.8x to 20.9x |
| Quarterly dividend of $2.52, $10.08 a year | yield about 2.2% on the price above |
| Annual dividend as a share of guided non-GAAP EPS | about 43% to 45% |
Price and consensus move daily, so check both with your broker before the release. MarketBeat shows a payout ratio of 62.65% (October 27), which is calculated on a different earnings basis than the non-GAAP guidance used here.
What to watch on November 3
- Non-GAAP EPS against $5.64 in Q3 2025 and against the $5.74 to $5.79 consensus. Non-GAAP EPS grew 1.1%, -0.4%, 5.1% and 4.5% in the last four quarters, while revenue grew 5.8% to 12.4%; consensus asks for +1.8% to +2.7% in EPS.
- Repatha. Sales grew between 33.5% and 43.6% against the year-earlier quarter in each of the last four quarters. Zacks shows a consensus of $1.04 billion, +31.0%.
- Prolia. Sales fell 32.4% in Q2 2026 against Q2 2025, and the Zacks consensus of $686 million would be a 39.8% decline from Q3 2025.
- Guidance. The August 4 ranges are $38.2 to $39.4 billion in revenue and $22.30 to $23.50 in non-GAAP EPS. Watch whether the company changes either range.
- Free cash flow. The first half of 2026 was $4,966 million against $2,891 million in the first half of 2025 (my calculation). Q3 2025 was $4,248 million, a high comparison.
- Margins and spending. The non-GAAP operating margin was 48.4% of product sales in Q2 2026 against 48.9% a year earlier. The company said research and development spending rose partly because of MariTide.
- MariTide. Several Phase 3 MARITIME studies in weight management are ongoing or enrolling, and three Phase 3 studies in type 2 diabetes are set to begin in 2026, according to the Q2 release.
- Buybacks. No shares were repurchased in Q2 2026, against a full-year limit of up to $3.0 billion.
The dividend
On October 27, 2026, Amgen announced a fourth-quarter dividend of $2.52 per share ($10.08 a year), the same amount as the third quarter and 6% above the $2.38 paid a year earlier. The record date is November 20, 2026 and it is payable on December 11, 2026, so the Q3 results come out before that date. The third-quarter dividend of $2.52 was declared on July 30, with a record date of August 21 and payment on September 11, 2026. Under the one-day settlement cycle in the U.S., the ex-dividend date normally falls on the record date (my note; confirm the date with your broker).
For investors in Europe
- AMGN pays in U.S. dollars, and U.S. withholding tax applies by default; the rate for non-U.S. investors depends on your broker having a valid Form W-8BEN. See our W-8BEN guide and our withholding tax overview.
- The dollar and euro exchange rate moves the euro value of the dividend independently of anything Amgen reports.
Sources
- Amgen: webcast of 2026 third-quarter financial results (October 2026)
- Amgen: Q3 2025 results, Form 8-K exhibit (November 4, 2025)
- Amgen: Q4 and full-year 2025 results and 2026 guidance, Form 8-K exhibit (February 3, 2026)
- Amgen: Q1 2026 results, Form 8-K exhibit (April 30, 2026)
- Amgen: Q2 2026 results, Form 8-K exhibit (August 4, 2026)
- Amgen: 2026 third-quarter dividend (July 30, 2026)
- Amgen: 2026 fourth-quarter dividend (October 27, 2026)
- Third-party data (consensus and price), not from the company: MarketBeat: AMGN Q3 2026 earnings page (close of October 30, 2026); MarketBeat (October 27, 2026); Zacks Equity Research via TradingView (undated, published before October 29, 2026)
Get new articles by email
Ex-dividend dates, earnings previews and P2P platform changes, straight to your inbox. Unsubscribe anytime.
Disclaimer: This article is for informational purposes only and does not constitute investment advice. Company figures are taken from the releases listed; consensus and the share price come from the third-party sources listed, as of the dates stated; and the second-half, fourth-quarter and valuation figures are my own arithmetic, not a company forecast. Confirm current figures with your broker or the company’s investor relations page. Investing involves risk, including the possible loss of capital, and a dividend payment is never guaranteed.