McDonald’s (NYSE: MCD) is expected to report third-quarter 2026 results on Wednesday, November 4, 2026, before the U.S. market opens. The date comes from calendar services (MarketBeat, TipRanks and Earnings Whispers); McDonald’s investor page did not yet list it when this was written on October 30, so treat it as unconfirmed. For the last two quarterly reports the company held its webcast at 7:30 a.m. Central (8:30 a.m. Eastern), so a similar time is likely, but that is also unconfirmed. This preview lines up the recent quarters against the same quarters a year earlier, works out what the company’s full-year outlook items imply for the rest of 2026, and covers analyst consensus, the dividend and what to watch.
The recent quarters, each against the same quarter a year earlier
| Metric | Q3 2025 (vs Q3 2024) | Q4 2025 (vs Q4 2024) | Q1 2026 (vs Q1 2025) | Q2 2026 (vs Q2 2025) |
|---|---|---|---|---|
| Total revenues | $7,078 million (+3.0% from $6,873 million) | $7,009 million (+9.7% from $6,388 million) | $6,517 million (+9.4% from $5,956 million) | $7,099 million (+3.7% from $6,843 million) |
| Revenue growth in constant currencies (company) | +1% | +6% | +4% | +2% |
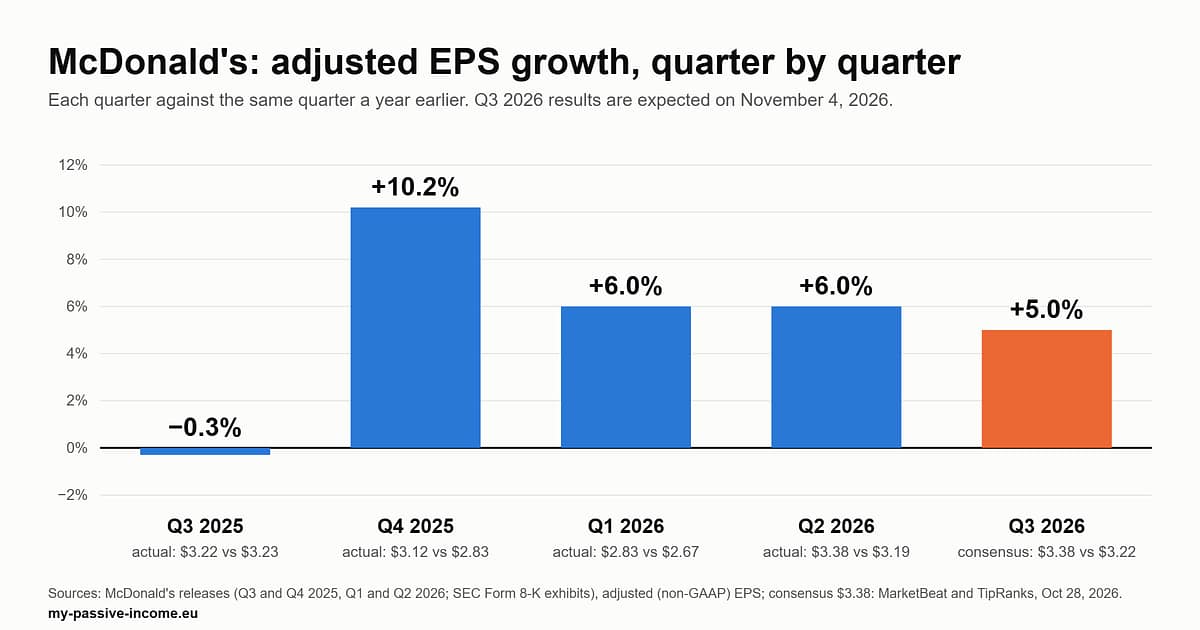
| Adjusted diluted EPS (excludes charges) | $3.22 (from $3.23: -0.3%) | $3.12 (from $2.83: +10.2%) | $2.83 (from $2.67: +6.0%) | $3.38 (from $3.19: +6.0%) |
| Reported (GAAP) diluted EPS | $3.18 (from $3.13: +1.6%) | $3.03 (from $2.80: +8.2%) | $2.78 (from $2.60: +6.9%) | $3.32 (from $3.14: +5.7%) |
| Operating margin, reported (my calculation) | 47.4% (from 46.4%) | 45.0% (from 44.9%) | 45.3% (from 44.5%) | 47.0% (from 47.2%) |
| Global comparable sales (year-earlier quarter in brackets) | +3.6% (-1.5%) | +5.7% (+0.4%) | +3.8% (-1.0%) | +1.3% (+3.8%) |
| U.S. comparable sales (year-earlier quarter in brackets) | +2.4% (+0.3%) | +6.8% (-1.4%) | +3.9% (-3.6%) | +0.8% (+2.5%) |
| Systemwide sales growth (company) | +8% (+6% in constant currencies) | +11% (+8% in constant currencies) | +11% (+6% in constant currencies) | +5% (+4% in constant currencies) |
Sources: the four McDonald’s earnings releases listed under Sources (Q3 2025 on November 5, 2025; Q4 and full-year 2025 on February 11, 2026; Q1 2026 on May 7, 2026; Q2 2026 on August 4, 2026). The percentage changes for revenues and EPS, and the operating margins, are my calculations from the dollar figures in the releases. Adjusted EPS excludes pre-tax charges, mainly restructuring tied to the company’s “Accelerating the Organization” programme: $0.04, $0.09, $0.05 and $0.06 per share in the four quarters above (the Q3 2024 base also excluded $0.10 per share of charges). The company says it expects to keep incurring such charges until the programme ends during 2027. In Q2 2026 the U.S. comparable sales gain of 0.8% came from higher average check and was partly offset by negative comparable guest counts. Selling, general and administrative expenses were $817 million against $700 million a year earlier (+16.7%, my calculation from the supplemental release).
What the full-year outlook implies for the second half (my calculation)
McDonald’s does not publish an EPS forecast. In the supplemental release of August 4, 2026 it gives outlook items for the full year 2026, and a few of them can be set against the first half. The table lines up each item with what the first half shows.
| Outlook item for 2026 (company, August 4) | Company outlook | First half 2026 and what it leaves for the second half (my calculation) |
|---|---|---|
| Operating margin | Mid-to-high 40% range | First half 46.2% ($6,292 million on $13,616 million of revenues); full-year 2025 was 46.1% and Q3 2025 was 47.4% |
| Interest expense | Up 4% to 6% for the year | First half $809 million (from $766 million). The guide implies $1,645 to $1,677 million for the year (from $1,582 million in 2025), so $836 to $868 million in the second half against $816 million a year earlier: +2.5% to +6.4% |
| Effective income tax rate | 21% to 23% for the year | First half 20.7% (Q2 alone was 19.5%, helped by discrete benefits). If second-half pre-tax income matched the first half, the rest of the year would need a rate of about 21.3% to 25.3% (illustration only) |
| SG&A | About 2.2% of Systemwide sales | No quarterly guide; Q2 SG&A grew 16.7% against a year earlier |
| Restaurant openings | About 2,600 openings and about 2,100 net additions; net unit expansion adds about 2.5% to Systemwide sales growth (constant currencies) | 46,028 restaurants at June 30, 2026, up 1,915 from a year earlier |
Other outlook items: capital expenditures of $3.7 to $3.9 billion and a free cash flow conversion rate in the low-to-mid 80% range. Foreign currency translation added $0.17 to first-half EPS ($0.03 in Q2), according to the company’s table. On EPS, here is the arithmetic that consensus implies, not a forecast. First-half adjusted EPS was $6.21 (Q1 $2.83 plus Q2 $3.38); if Q3 matches the $3.38 consensus, nine-month adjusted EPS would be $9.59, up 5.6% from $9.08 in the first nine months of 2025. Against 2025 adjusted EPS of $12.20, full-year growth of 5% ($12.81) would leave $3.22 for Q4 (+3.2% against $3.12), and growth of 6% ($12.93) would leave about $3.34 (+7.1%).
What analysts expect, and the share price
This section uses third-party data, which is not from the company; each figure carries its source and date. Consensus is for the same quarter, compared with the same quarter a year earlier. I did not find a published consensus for comparable sales.
| Q3 metric | Consensus for Q3 2026 | Q3 2025 actual (company) | Change |
|---|---|---|---|
| Adjusted EPS | $3.38 (MarketBeat, October 28, 2026; TipRanks, October 2026) | $3.22 | +5.0% |
| Total revenues | $7.29 billion (MarketBeat, October 28, 2026); $7,292 million (Hudson Labs, October 7, 2026) | $7,078 million | +3.0% |
For context, Q3 2025 adjusted EPS of $3.22 came in below the $3.33 consensus of the time (TipRanks, November 4, 2025). Hudson Labs, in a preview dated October 7, 2026, lists an EPS consensus of $3.41 on a different basis, so figures differ by source.
MCD closed at $250.54 on Wednesday, October 28, 2026, up 0.43% on the day (source: MarketBeat, October 28, 2026); MarketBeat gives a 52-week range of $229.20 to $341.75 (October 26, 2026). Using that close (my calculation):
| Measure | Value |
|---|---|
| Share price (close, Oct 28, 2026) | $250.54 |
| Adjusted EPS, last four reported quarters (Q3 2025 $3.22, Q4 $3.12, Q1 2026 $2.83, Q2 $3.38) | $12.55 |
| Price to those four quarters of adjusted EPS | about 20.0x |
| Quarterly dividend of $1.93, $7.72 a year | yield about 3.1% on the price above |
| Annual dividend as a share of adjusted EPS | about 61.5% of the $12.55 above; about 63.3% of 2025 adjusted EPS of $12.20 |
MarketBeat (October 26, 2026) shows a “Moderate Buy” analyst consensus: 1 Strong Buy, 22 Buy, 13 Hold and 1 Sell, with an average price target of $295.64 (range $230 to $390). Ratings and price targets are analysts’ opinions, not a recommendation from this site. Price and consensus move daily, so check both with your broker before the release.
What to watch on November 4
- Adjusted EPS against $3.22 in Q3 2025 and against the $3.38 consensus. Adjusted EPS grew 10.2% in Q4 2025 and 6.0% in each of Q1 and Q2 2026; consensus asks for +5.0% in Q3.
- U.S. comparable sales and guest counts. Q2 was +0.8% with negative guest counts, against a Q3 2025 base of +2.4%. According to the Q2 call transcript on MarketBeat (third-party), management said U.S. comparable sales were slightly negative in July and that the fixes would take time to show up.
- International comparable sales. International Operated Markets rose 1.5% and the Developmental Licensed Markets 1.9% in Q2, against Q3 2025 bases of +4.3% and +4.7%. The same transcript has management expecting both to accelerate from Q2.
- Margin and costs. Operating margin was 47.0% in Q2 and 47.4% in Q3 2025; SG&A rose 16.7% in Q2 against a full-year outlook of about 2.2% of Systemwide sales.
- The outlook items. Whether the August 4 items (operating margin, interest, tax rate, capital expenditures and openings) are repeated or changed in the Q3 supplemental release.
- The “NEXT” strategy. On September 23, 2026 the company set targets that include an operating margin in the low-to-mid 50% range by 2030, about $8.5 billion of partnering support for franchisees through 2036 (about $5 billion through 2030) and a unit-expansion contribution of nearly 2.5% to Systemwide sales growth in 2027. These are company targets, not forecasts by this site; watch how management links them to 2026 costs.
- Restructuring charges of $0.04 to $0.09 per share in each of the last four quarters, which keep reported and adjusted EPS apart.
The dividend
On September 17, 2026, McDonald’s declared a quarterly dividend of $1.93 per share ($7.72 a year), up 4% from $1.86 and described by the company as its 50th consecutive year of dividend increases. The record date is December 1, 2026 and it is payable on December 15, 2026. MarketBeat lists December 1 as the ex-dividend date, which, with next-day settlement, is the same day as the record date, so shares bought before that day carry this payment. The payment is already declared and is not tied to the November 4 report.
For investors in Europe
- MCD pays in U.S. dollars, and U.S. withholding tax applies by default; the rate for non-U.S. investors depends on your broker having a valid Form W-8BEN. See our W-8BEN guide.
- The dollar and euro exchange rate moves the euro value of the dividend independently of anything McDonald’s reports.
Sources
- McDonald’s: Q3 2025 results, Form 8-K exhibit 99.1 (November 5, 2025)
- McDonald’s: Q4 and full-year 2025 results, Form 8-K exhibit 99.1 (February 11, 2026)
- McDonald’s: Q1 2026 results, Form 8-K exhibit 99.1 (May 7, 2026)
- McDonald’s: Q2 2026 results, Form 8-K exhibit 99.1 (August 4, 2026)
- McDonald’s: Q2 2026 supplemental information with the 2026 outlook, Form 8-K exhibit 99.2 (August 4, 2026)
- McDonald’s: NEXT strategy and financial targets, Form 8-K exhibit 99.1 (September 23, 2026)
- McDonald’s: quarterly dividend release (September 17, 2026)
- Third-party data (report date, consensus, price, ratings, call transcript), not from the company: MarketBeat: Q3 2026 earnings date and estimates (October 28, 2026); TipRanks: MCD earnings dates and estimates (October 2026); Earnings Whispers: week of November 2, 2026; Hudson Labs: Q3 2026 preview (October 7, 2026); MarketBeat: MCD price and analyst ratings (October 26, 2026); MarketBeat: Q2 2026 call transcript (August 4, 2026); TipRanks: Q3 2025 consensus (November 4, 2025)
Get new articles by email
Ex-dividend dates, earnings previews and P2P platform changes, straight to your inbox. Unsubscribe anytime.
Disclaimer: This article is for informational purposes only and does not constitute investment advice. Company figures are taken from the releases listed; the report date, consensus, share price, analyst ratings and call transcript come from the third-party sources listed, as of the dates stated; and the percentage changes, margins, second-half, full-year and valuation figures are my own arithmetic, not a company forecast. Confirm the report date and current figures with your broker or the company’s investor relations page. Investing involves risk, including the possible loss of capital, and a dividend payment is never guaranteed.