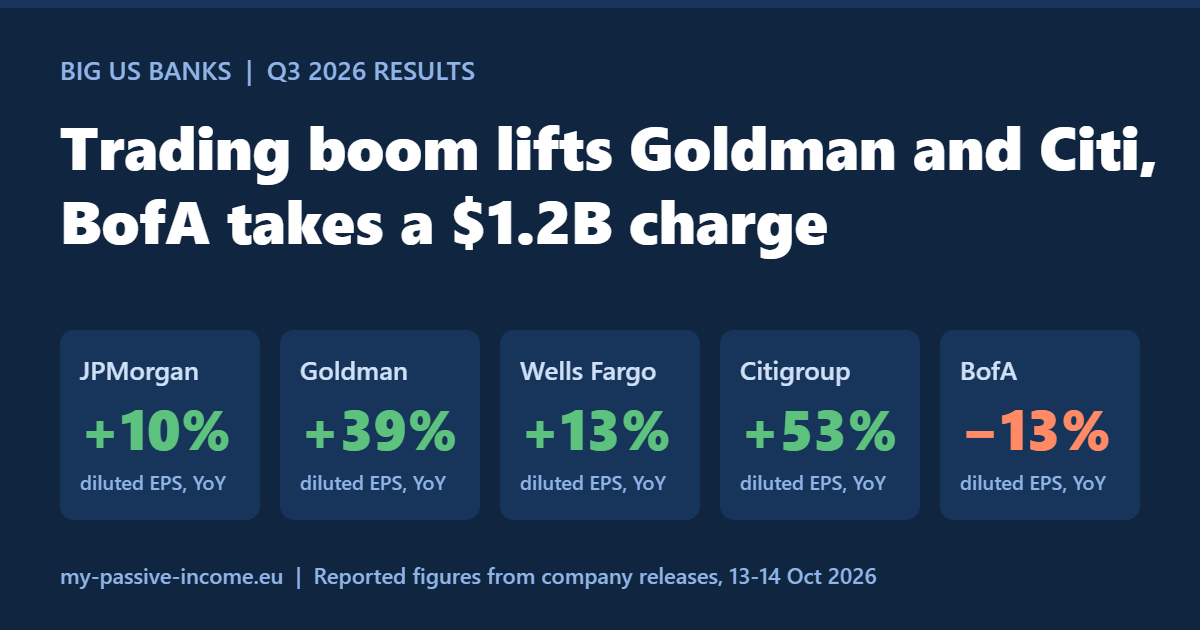
Four large U.S. banks reported third-quarter 2026 results on Tuesday, October 13, and Bank of America followed on Wednesday, October 14. The common thread was a strong quarter in stock trading. The exceptions were Bank of America, which booked a $1.2 billion regulatory settlement charge, and Wells Fargo, where profit grew but provisions for bad loans jumped 51%. Here is what the reports say, with the figures that matter for someone who owns bank shares for the dividend.
Morgan Stanley had not published its Q3 release when this was written, so it is not included. All percentages compare with the third quarter of 2025 and use the figures as reported by each bank.
The scorecard
| Bank | Revenue | Net income | Diluted EPS | Return on equity | CET1 |
|---|---|---|---|---|---|
| JPMorgan | $50.17B (+8%) | $15.31B (+6%) | $5.57 (+10%) | 20% ROTCE | 13.9% |
| Goldman Sachs | $18.68B (+23%) | $5.29B (+29%) | $17.01 (+39%) | 18.7% ROE | 12.4% |
| Wells Fargo | $21.87B (+2%) | $5.95B (+6%) | $1.87 (+13%) | 16.3% ROTCE | 10.0% |
| Citigroup | $23.85B (+8%) | $5.25B (+40%) | $2.85 (+53%) | 11.5% ROTCE | 12.8% |
| Bank of America | $29.96B (+3%) | $6.93B (−17%) | $0.91 (−13%) | 12.6% ROTCE | 10.9% |
ROTCE is return on tangible common equity, a profitability measure banks report; Goldman Sachs reports return on equity (ROE). CET1 is the main regulatory capital ratio (higher means a bigger cushion); the ratios are preliminary estimates; JPMorgan’s is the standardized measure. Percentages are rounded.
Trading did the heavy lifting
Equities trading was the standout. JPMorgan’s equity markets revenue rose 49% to about $5.0 billion, and Goldman Sachs’s equities revenue rose 72% to $6.44 billion. Bond and currency trading was weaker: JPMorgan’s fixed income revenue fell 4% to about $5.4 billion, Goldman’s FICC (fixed income, currencies and commodities) was down 1% at $3.47 billion, and Bank of America’s FICC revenue fell 17% to $2.6 billion. Citigroup reports one combined Markets line, which grew 6% to $6.11 billion. Wells Fargo does not report the same split.
JPMorgan: steady, with a one-off hit
JPMorgan earned $15.31 billion, or $5.57 a share, up 10% per share. Revenue was $50.17 billion as reported ($50.91 billion on the managed basis the bank also uses). The quarter included a $658 million pre-tax loss on investment securities; excluding it, net income would have been $15.8 billion and EPS $5.75. Return on tangible common equity was 20%. Provisions for credit losses fell 19% to $2.74 billion, and the card net charge-off rate was 2.91%. The CET1 ratio was 13.9% on the standardized measure, the highest of the five.
Goldman Sachs: the strongest growth
Goldman’s net revenue rose 23% to $18.68 billion and EPS rose 39% to $17.01, helped by the equities result above. Investment banking fees rose 21% to $3.22 billion. Goldman bought back $3.0 billion of stock in the quarter and declared a $5.00 per-share dividend. Its CET1 ratio was 12.4%, down from 12.9% at June 30, in a quarter with a $3.0 billion buyback.
Wells Fargo: profit up, but more set aside for bad loans
Wells Fargo earned $5.95 billion, or $1.87 a share (+13%), on revenue up 2% to $21.87 billion. Net interest income, the gap between what it earns on loans and pays on deposits, rose 5% to $12.52 billion. The less comfortable number is the provision for credit losses, which rose 51% to $1.03 billion, while net charge-offs rose only 3% to $983 million. The bank repurchased 28.6 million shares for $2.5 billion, and its preliminary CET1 ratio was 10.0%, down from 11.0% a year earlier.
Citigroup: big growth, but read the footnote
Citigroup’s net income rose 40% to $5.25 billion and EPS rose 53% to $2.85. Most of that jump comes from last year’s quarter, which included a $726 million goodwill charge tied to the planned sale of a 25% stake in Banamex. Excluding that item, last year’s EPS was $2.24, so the underlying increase was 27%. Return on tangible common equity improved to 11.5% from 8.0%, still the lowest of the five. Citi returned $4.1 billion to common shareholders through dividends and buybacks, and its CET1 ratio was 12.8%.
Bank of America: the settlement charge
Bank of America reported net income of $6.93 billion, or $0.91 a share, against $8.33 billion and $1.04 a year earlier. The drop comes from a $1.2 billion charge ($0.17 a share) for civil money penalties after consent orders with the OCC and FinCEN over its anti-money-laundering and sanctions compliance programs. The charge is not tax-deductible. Excluding it, the bank reports adjusted net income of $8.1 billion and EPS of $1.08, which is 4% above last year’s $1.04. Revenue rose 3% to $29.96 billion, helped by net interest income up 8% to $16.4 billion. Bank of America returned $8.3 billion, the largest total among the figures reported here, including $6.0 billion of buybacks, and its CET1 ratio fell to 10.9% from 11.6%.
Credit quality
Losses on loans were broadly stable, but the direction of provisions differed by bank. JPMorgan and Bank of America set aside less than a year ago; Wells Fargo set aside far more; Citigroup and Goldman Sachs a little more. Provisions are the money banks reserve for expected losses, so a rising number is worth watching but is not a loss by itself.
| Bank | Provision Q3 2026 | Provision Q3 2025 | Change | Net charge-offs Q3 2026 (Q3 2025) |
|---|---|---|---|---|
| JPMorgan | $2.74B | $3.40B | −19% | $2.2B ($2.6B) |
| Goldman Sachs | $368M | $339M | +9% | not in release |
| Wells Fargo | $1.03B | $681M | +51% | $983M ($954M) |
| Citigroup | $2.59B | $2.45B | +6% | $2.22B ($2.21B) |
| Bank of America | $1.27B | $1.30B | −2% | $1.35B ($1.37B) |
What shareholders got
| Bank | Dividends | Share buybacks | Notes |
|---|---|---|---|
| JPMorgan | $4.4B, or $1.65 per share | $664M net | Last-12-month net payout 61%; CEO said buybacks were reduced |
| Goldman Sachs | $5.00 per share declared | $3.00B (2.9M shares, average $1,048.73) | CET1 12.4%, from 12.9% at June 30 |
| Wells Fargo | not in release | $2.5B (28.6M shares) | CET1 10.0% is a preliminary estimate |
| Citigroup | $4.1B returned to common holders, dividends and buybacks combined | (combined) | Release does not split the two |
| Bank of America | $2.2B | $6.0B | $8.3B returned in total |
Goldman Sachs, Wells Fargo, Citigroup and Bank of America all reported a lower CET1 ratio than a year earlier or than the previous quarter (JPMorgan’s release gave no comparison). Falling ratios alongside large buybacks suggest capital is being returned faster than it is built, which supports payouts now but leaves a smaller cushion if loan losses rise.
Still to come, and taxes for non-U.S. holders
Morgan Stanley is scheduled to report on October 14. If you hold U.S. bank shares from outside the United States, remember that dividends are subject to U.S. withholding tax, 30% by default unless you have a valid Form W-8BEN on file with your broker. Our guide to Form W-8BEN explains the treaty rates by country.
Sources
- JPMorgan Chase, Form 8-K, Q3 2026 earnings release (October 13, 2026)
- Goldman Sachs, Form 8-K, Q3 2026 earnings results (October 13, 2026)
- Wells Fargo, Form 8-K, Q3 2026 earnings release (October 13, 2026)
- Citigroup, Form 8-K, Q3 2026 earnings release (October 13, 2026)
- Bank of America, Form 8-K, Q3 2026 earnings release (October 14, 2026)
- Bank of America, Form 8-K, Q3 2026 supplemental financial information (October 14, 2026)
Disclaimer: This article is for informational purposes only and does not constitute investment advice. Figures are taken from the company releases above as of October 13-14, 2026 and several, such as capital ratios, are preliminary; confirm current numbers on each bank’s investor relations page. Investing involves risk, including the possible loss of capital, and a dividend is never guaranteed. This article contains no affiliate links.