Merck & Co. (NYSE: MRK) reports third-quarter 2026 results on Thursday, October 29, 2026, with its earnings call and live webcast at 9:00 a.m. Eastern. In August the company raised its full-year sales guidance but cut its non-GAAP EPS guidance from $5.04 to $5.16 down to $2.66 to $2.76, after adding a one-time charge for the Terns acquisition. This preview lines up the recent quarters against the same quarters a year earlier, works out what the guidance implies for the second half, and covers analyst consensus, the dividend and what to watch.
Merck’s announcement of the call gives the time of the call but not the time of the release; for reference, its first-quarter release came out at 6:30 a.m. Eastern on April 30, 2026.
The recent quarters, each against the same quarter a year earlier
| Metric | Q3 2025 (vs Q3 2024) | Q4 2025 (vs Q4 2024) | Q1 2026 (vs Q1 2025) | Q2 2026 (vs Q2 2025) |
|---|---|---|---|---|
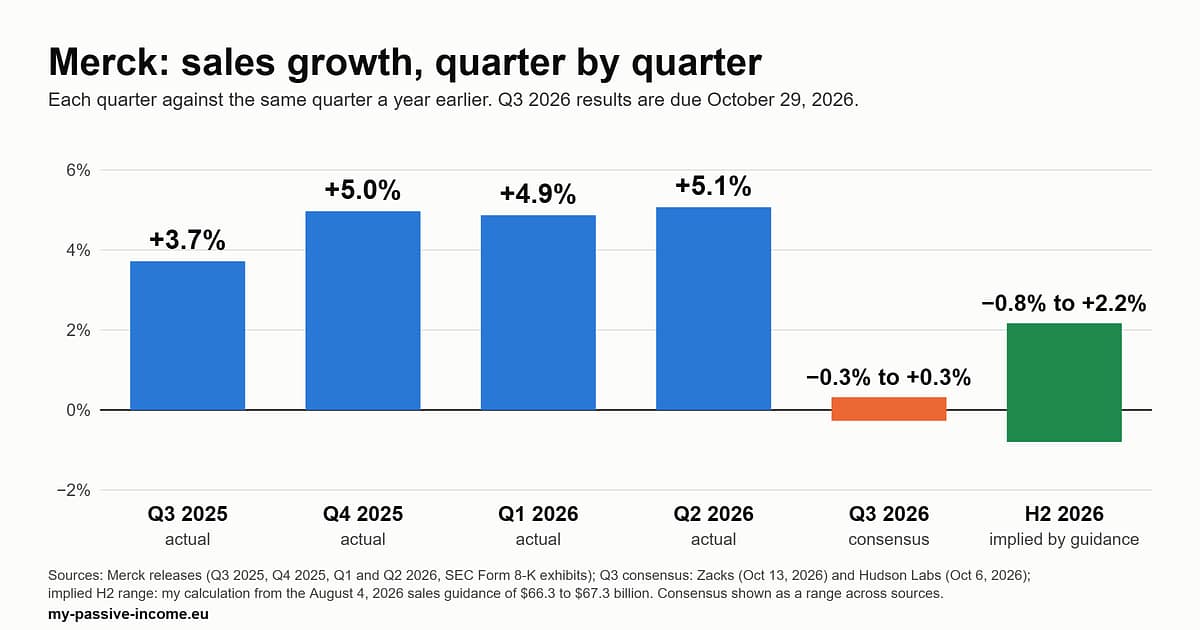
| Worldwide sales | $17,276 million (+3.7% from $16,657 million) | $16,400 million (+5.0% from $15,624 million) | $16,286 million (+4.9% from $15,529 million) | $16,607 million (+5.1% from $15,806 million) |
| Non-GAAP EPS | $2.58 (from $1.57: +64.3%) | $2.04 (from $1.72: +18.6%) | -$1.28 (from $2.22; not meaningful, see note) | -$0.13 (from $2.13; not meaningful, see note) |
| GAAP EPS | $2.32 (from $1.24) | $1.19 (from $1.48) | -$1.72 (from $2.01) | -$0.54 (from $1.76) |
| Keytruda / Keytruda Qlex (as reported) | $8,142 million (+9.6% from $7,429 million) | $8,372 million (+6.8% from $7,836 million) | $8,034 million (+11.5% from $7,205 million) | $8,366 million (+5.2% from $7,956 million) |
| Gardasil / Gardasil 9 | $1,749 million (-24.2% from $2,306 million) | $1,031 million (-33.5% from $1,550 million) | $1,069 million (-19.4% from $1,327 million) | $1,169 million (+3.8% from $1,126 million) |
| Animal Health | $1,615 million (+8.6% from $1,487 million) | $1,505 million (+7.7% from $1,397 million) | $1,791 million (+12.8% from $1,588 million) | $1,775 million (+7.8% from $1,646 million) |
Sources: the four Merck earnings releases listed under Sources (Q3 2025 on October 30, 2025; Q4 and full-year 2025 on February 3, 2026; Q1 2026 on April 30, 2026; Q2 2026 on August 4, 2026). The percentage changes are my calculations from the figures in the releases, so they can differ by a tenth of a point from the rounded changes the company prints. The four 2025 quarterly sales figures add up to the company’s full-year 2025 sales of $65,011 million.
Note on EPS. Merck counted two one-time acquisition charges in its non-GAAP EPS: $3.62 per share for Cidara in Q1 2026 and $2.31 per share for Terns in Q2 2026. That is why the first two quarters of 2026 show losses. Adding the per-share charges back (my arithmetic, ignoring any tax and financing effects, so not a company figure) gives about $2.34 for Q1 against $2.22 a year earlier (+5.4%) and about $2.18 for Q2 against $2.13 (+2.3%).
Full-year guidance: three updates
| Metric (full year 2026) | February 3, 2026 | April 30, 2026 | August 4, 2026 |
|---|---|---|---|
| Sales | $65.5 to $67.0 billion (+0.8% to +3.1% on $65,011 million, my calculation) | $65.8 to $67.0 billion (+1.2% to +3.1%) | $66.3 to $67.3 billion (+2.0% to +3.5%) |
| Non-GAAP EPS | $5.00 to $5.15 | $5.04 to $5.16 | $2.66 to $2.76 |
| Acquisition charges in the EPS range | Cidara, about $3.65 per share (plus about $0.30 per share of related financing and other costs) | Cidara; the Terns acquisition was not yet reflected | Cidara $3.62 and Terns $2.31 per share, plus about $0.12 per share to finance Terns and advance MK-4208 |
Sources: the Merck releases of February 3, April 30 and August 4, 2026. For the full year 2025 the company reported sales of $65,011 million and non-GAAP EPS of $8.98 (from $7.65 in 2024). The August outlook includes a currency benefit of about 1% on sales and about $0.15 per share on EPS (at mid-July 2026 rates), does not assume additional significant business development transactions and uses a share count of approximately 2.48 billion. Merck gives no GAAP EPS outlook.
What the guidance implies for the second half (my calculation)
| Item | Sales | Non-GAAP EPS |
|---|---|---|
| First half 2025 (Q1 + Q2) | $31,335 million | $4.35 ($2.22 + $2.13) |
| Second half 2025 (Q3 + Q4) | $33,676 million | $4.62 ($2.58 + $2.04) |
| First half 2026 (Q1 + Q2) | $32,893 million (+5.0% vs first half 2025) | -$1.41 (company six-month figure) |
| Full-year 2026 guidance (August 4) | $66.3 to $67.3 billion | $2.66 to $2.76 |
| Implied second half 2026 | $33,407 to $34,407 million | $4.07 to $4.17 |
| Implied growth, second half 2026 vs second half 2025 | -0.8% to +2.2% | -11.9% to -9.7% |
In other words, the guidance has sales growth slowing from about 5% in the first half to between a small decline and about 2% in the second half, and EPS roughly 10% to 12% below the second half of 2025. The quarterly figures for 2025 add up to $8.97, one cent below the company’s $8.98 for the year, a rounding difference. The release I reviewed gives no third-quarter or second-half expectations, so this gap is something to listen for on the call. These are my own calculations from company figures; the company does not publish a second-half forecast. Adding back the two charges the company quantifies ($3.62 plus $2.31, or $5.93) gives roughly $8.59 to $8.69 for the full year against $8.98 in 2025, or -4.3% to -3.2% (my arithmetic, ignoring financing costs and taxes).
What analysts expect, and the share price
This section uses third-party data, which is not from the company; each figure carries its source and date. Consensus is for the same quarter, compared with the same quarter a year earlier. Sources differ slightly, so ranges are shown.
| Q3 metric | Consensus for Q3 2026 | Q3 2025 actual (company) | Change |
|---|---|---|---|
| Non-GAAP EPS | $2.12 (Zacks and Barchart, both October 13, 2026); about $2.13 (OptionBeast, October 26, 2026) | $2.58 | -17.8% to -17.4% |
| Worldwide sales | $17.23 billion (Zacks, October 13); $17,332 million (Hudson Labs, October 6); about $17.3 billion (OptionBeast, October 26) | $17,276 million | -0.3% to +0.3% |
If Q3 EPS comes in at the $2.12 consensus, the implied second half of $4.07 to $4.17 leaves $1.95 to $2.05 for the fourth quarter, against $2.04 in Q4 2025: between -4.4% and +0.5%. If Q3 sales are about $17.3 billion, the implied Q4 is about $16.1 to $17.1 billion against $16,400 million in Q4 2025, or roughly -1.8% to +4.3% (my calculations). A beat or miss in Q3, or a change to guidance, would shift that picture.
MRK closed at $140.61 on Monday, October 26, 2026, down 3.2% on the day (source: GuruFocus, October 26, 2026); MarketBeat showed $141.72 mid-day on the same date. The 52-week range was $82.01 to $156.92 (GuruFocus). MarketBeat, on the same date, listed a “Moderate Buy” analyst consensus (17 buy, 9 hold and 1 sell rating) and an average price target of $153.12; these are third-party opinions, not company data. Using the closing price (my calculation):
| Measure | Value |
|---|---|
| Share price (close, Oct 26, 2026) | $140.61 |
| Price to 2025 non-GAAP EPS of $8.98 | about 15.7x |
| Quarterly dividend of $0.85, $3.40 a year | yield about 2.4% on the price above |
| Annual dividend as a share of 2025 non-GAAP EPS | about 38% |
| Annual dividend as a share of 2026 guided non-GAAP EPS ($2.66 to $2.76) | about 123% to 128%, because the guided EPS includes $5.93 per share of one-time charges |
| Annual dividend as a share of guided EPS with the two charges added back ($8.59 to $8.69) | about 39% to 40% |
Price and consensus move daily, so check both with your broker before the release.
What to watch on October 29
- Sales against $17,276 million in Q3 2025. Sales grew between 3.7% and 5.1% in each of the last four quarters, while consensus for Q3 is roughly flat (-0.3% to +0.3%).
- Non-GAAP EPS against $2.58 in Q3 2025 and against the $2.12 consensus. The Cidara and Terns charges fell in Q1 and Q2, so Q3 is the first quarter of 2026 where the year-on-year comparison is not dominated by one of them; a new acquisition could change that.
- Keytruda and Keytruda Qlex. Combined sales were $8,366 million in Q2 (+5.2%), of which Keytruda Qlex was $463 million, up from $128 million in Q1. The Q3 2025 comparison is $8,142 million.
- Gardasil. The comparison base is high: $1,749 million in Q3 2025, against $1,031 million in Q4 2025, $1,069 million in Q1 2026 and $1,169 million in Q2 2026 (the first year-on-year increase in this set, +3.8%).
- Animal Health. Sales were $1,775 million in Q2 (+7.8%), against $1,615 million in Q3 2025.
- Guidance. The sales range has risen twice (its low end in April, both ends in August), while the EPS range was reset in August for the Terns charge. Watch whether either range changes, and whether the company mentions new acquisitions, which the outlook does not assume.
The dividend
Merck pays a quarterly dividend of $0.85 per share ($3.40 a year). The most recent one was announced on July 29, 2026, with a record date of September 15 and payment on October 7, 2026, and the one before that was announced on May 26 (record date June 15, paid July 8). I found no announcement of the next dividend yet, so buying shares now does not earn the October payment. A year ago Merck announced its first-quarter 2026 dividend on November 18, 2025 ($0.85, record date December 15, paid January 8, 2026); a similar timetable this year is my expectation, not something the company has confirmed.
For investors in Europe
- MRK pays in U.S. dollars, and U.S. withholding tax applies by default; the rate for non-U.S. investors depends on your broker having a valid Form W-8BEN. See our W-8BEN guide.
- The dollar and euro exchange rate moves the euro value of the dividend independently of anything Merck reports.
Sources
- Merck: Third-quarter 2026 sales and earnings conference call announcement (October 1, 2026)
- Merck: Q3 2025 results, Form 8-K exhibit (October 30, 2025)
- Merck: Q4 and full-year 2025 results and 2026 guidance, Form 8-K exhibit (February 3, 2026)
- Merck: Q1 2026 results (April 30, 2026)
- Merck: Q2 2026 results, Form 8-K exhibit (August 4, 2026)
- Merck: first-quarter 2026 dividend announcement (November 18, 2025)
- Merck: third-quarter 2026 dividend announcement (May 26, 2026), via BioSpace
- Merck: fourth-quarter 2026 dividend announcement (July 29, 2026), via BioSpace
- Third-party data (consensus, price and analyst ratings), not from the company: Zacks via Yahoo Finance (October 13, 2026); Barchart via Yahoo Finance (October 13, 2026); Hudson Labs (October 6, 2026); OptionBeast (October 26, 2026); GuruFocus (October 26, 2026); MarketBeat (October 26, 2026)
Get new articles by email
Ex-dividend dates, earnings previews and P2P platform changes, straight to your inbox. Unsubscribe anytime.
Disclaimer: This article is for informational purposes only and does not constitute investment advice. Company figures are taken from the releases listed; consensus, the share price and analyst ratings come from the third-party sources listed, as of the dates stated; and the second-half, fourth-quarter, percentage-change and valuation figures are my own arithmetic, not a company forecast. Confirm current figures with your broker or the company’s investor relations page. Investing involves risk, including the possible loss of capital, and a dividend payment is never guaranteed.